
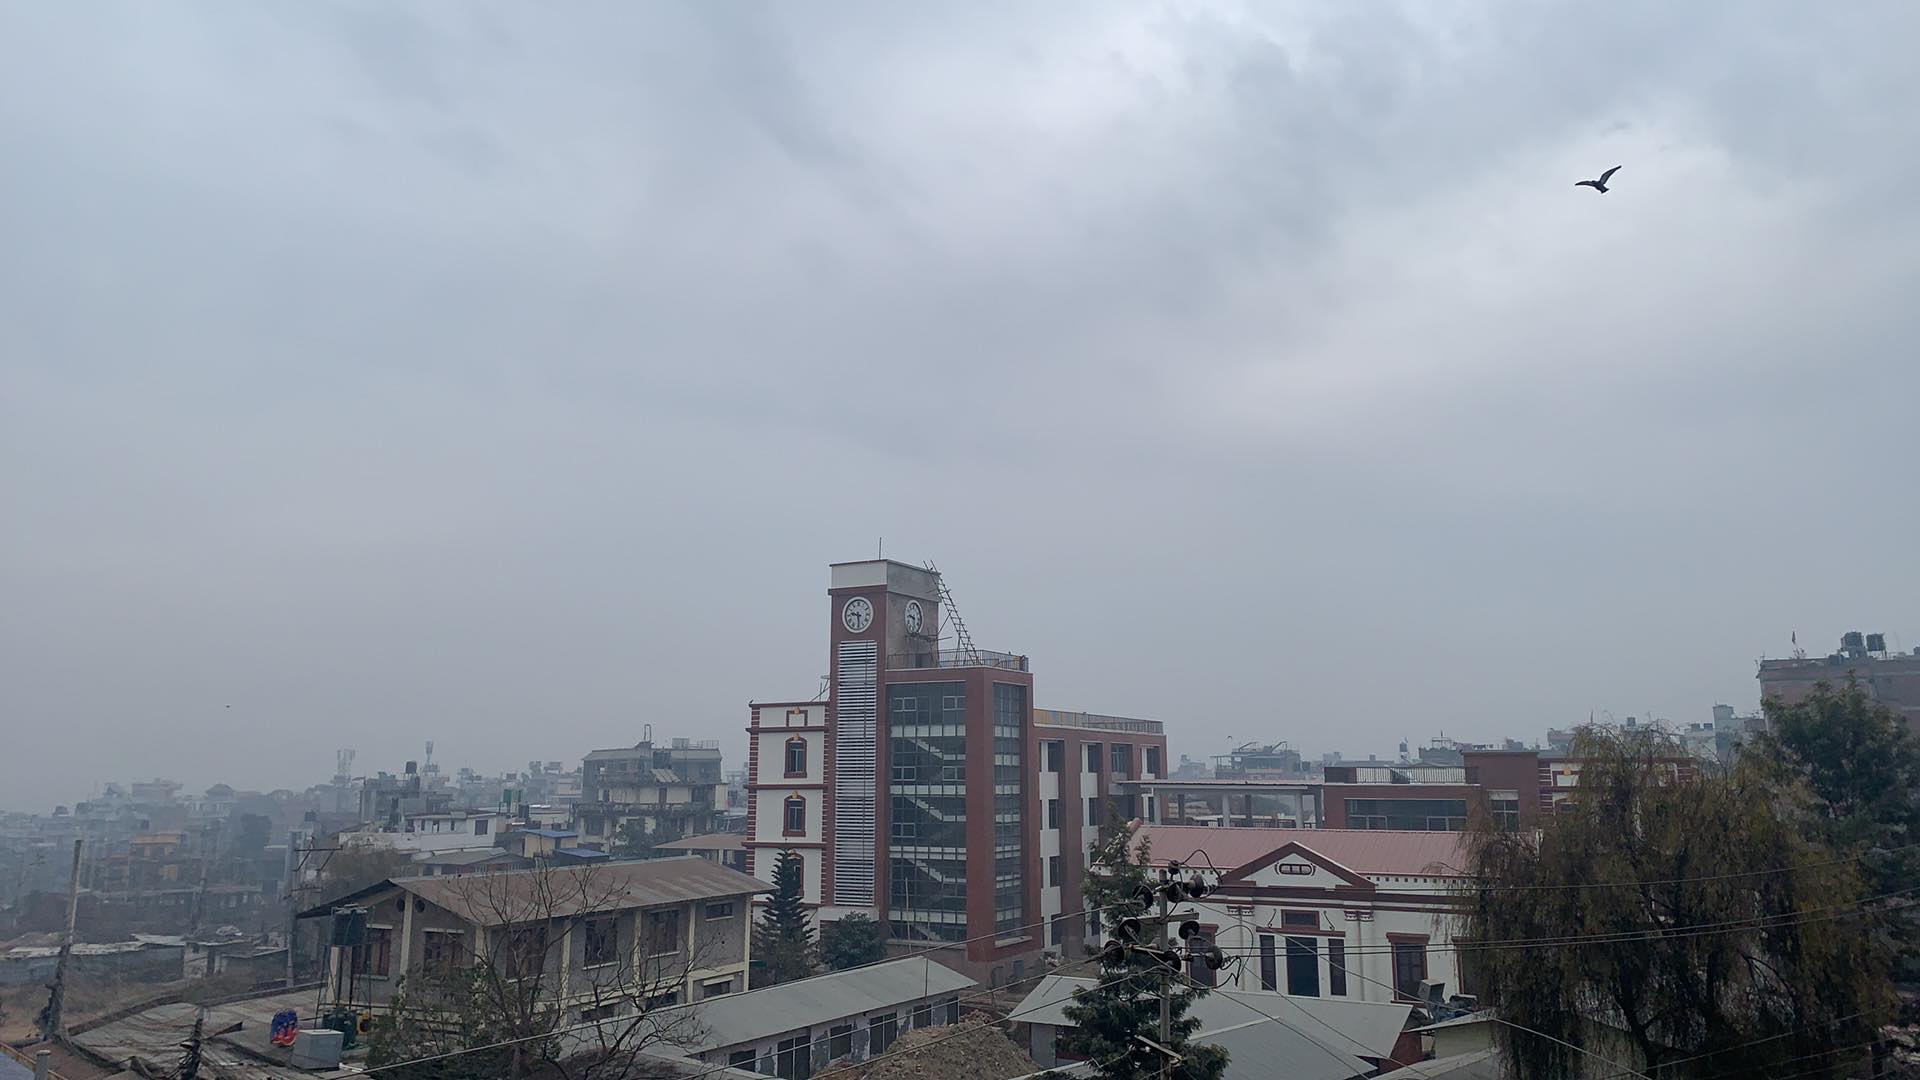
Kathmandu Valley witnessed hazardous levels of air pollution on 4-5 January 2021, with the Air Quality Index (AQI) highest among cities in the world that week. The pollution level had been stable or slightly below the daily average in the preceding days.
Air pollution over an area is determined by emissions and their transport. Sources of pollution can be both local and remote, whereas it can be carried into and out of the area depending on its geographical setting and atmospheric condition.
Understanding the role of geography and seasonal climatic variations in altering air pollution levels in Nepal has been generally well understood. The role of weather events in air pollution fluctuation is of key importance in predicting pollution levels across the country. Predicting weather therefore is closely related to predicting air pollution.
Pollution forecasting a few days in advance has practical as well as policy implications. If pollution levels can be predicted a few days in advance, people can plan their activities accordingly. It also allows the government ample time to introduce temporary restrictions to reduce the severity of pollution during adverse weather conditions.
The alarming levels of pollution in Kathmandu Valley in winter has been receiving much publicity, and has been a matter of serious concern. The high pollution episode on 4-5 January got widespread publicity in the media, raising public awareness about the issue.
Residents of Kathmandu already taking precautions against the Covid-19 pandemic were made conscious of the additional hazards of poor air quality on their health.
As the PM2.5 AQI (the concentration of fine particles less than 2.5 microns in diameter) exceeded 600 at its peak in some areas of the Valley, the Department of Environment (DoE) issued a press release on 5 January, urging people to remain indoors as far as possible and refrain from making open fires. It was also advised that the high level of pollution could prevail for some time, depending on how weather impacted its diffusion.
Research has shown that the lifespan of some Nepalis has been reduced by up to five years because of the air we breathe. Advance knowledge of the situation would have been more useful for the public.
Every time there is a discourse on Kathmandu’s pollution situation, experts flag their opinions citing the topography of the valley and winter inversion as the major factors that trap polluted air.
In the case of the early January pollution event, however, the air pollution level decreased to pre-episode level from 6 January onwards, which promoted an analysis of the impact that cloud cover from a westerly front had on AQI.
The daily and hourly time series of air pollution level and concentration of gases was recorded by air quality monitoring stations for the analysis. A newly established Department of Hydrology and Meteorology (DHM) monitoring station at Nagarkot as well as from other measurements in the valley were used. The vertical atmospheric profile measured by DHM’s radiosonde station at Kirtipur, satellite imagery and surface weather charts related to the first week of January were reference points.
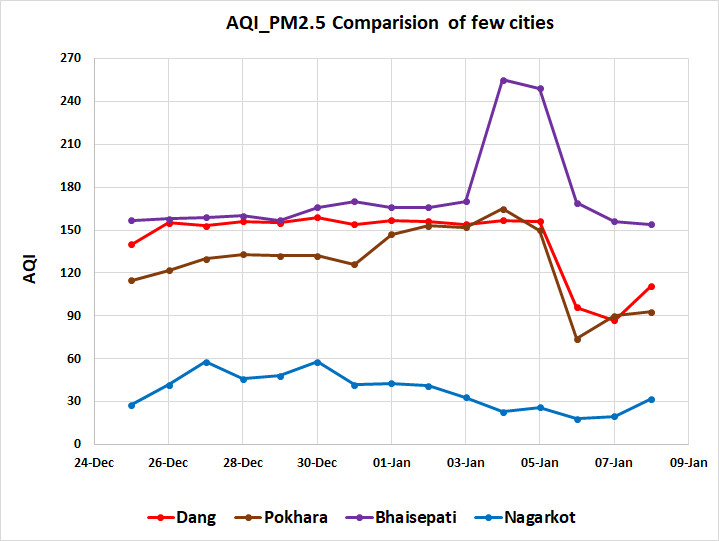
A comparison of the time series of high-frequency PM2.5 counts shows that hazardous air quality levels were recorded within the Kathmandu Valley in Bhaisepati, Bhaktapur and Ratna Park areas. These measurements were also compared to air quality in cities across Nepal.
Air quality deteriorated to dangerous levels from the afternoon of 4 January till the morning of 6 January, whereas such counts were comparable to those recorded before and after the hazardous air level episode in Nepalganj, Dang, Pokhara, Hetauda.
A comparison of AQI PM2.5 daily average time series shows that their values on 4 and 5 January is comparable with the values on preceding days at the same stations outside the valley, whereas it dropped by 30% or more on 6-7 January for Nepalganj, Dang, and Pokhara stations.
However, the stations at Ratna Park and Bhaisepati recorded a 50% rise in pollution levels on 4 and 5 January, whereas the Bhaktapur station recorded only a 15% rise.
In contrast, the Nagarkot station recorded better air quality by about 40% or more from 4-7 January. Similarly, the concentration of ozone, nitrous oxides, carbon monoxide and black carbon-8 (soot particles) also came down by about 10% or more in Nagarkot during the period compared to preceding days, which is consistent with the reduction of AQI PM2.5 there.
It is worth noting that Nagarkot and surrounding regions on the eastern rim of the Valley are considered as the primary outflow region for wind-blown pollutants from inside the valley trough since upper-level wind is predominantly westerly across Nepal in winter. In fact, this was why the DHM selected Nagarkot as the site for establishing an air quality monitoring station.
The differences in the daily average for the AQI PM2.5 count for the stations in the Valley and that at Nagarkot are of particular interest. The measurements for 4-6 January could mean that the stations could be valuable in enhancing our understanding of the variation of ambient air quality in the valley over time, and the transport of pollutants.
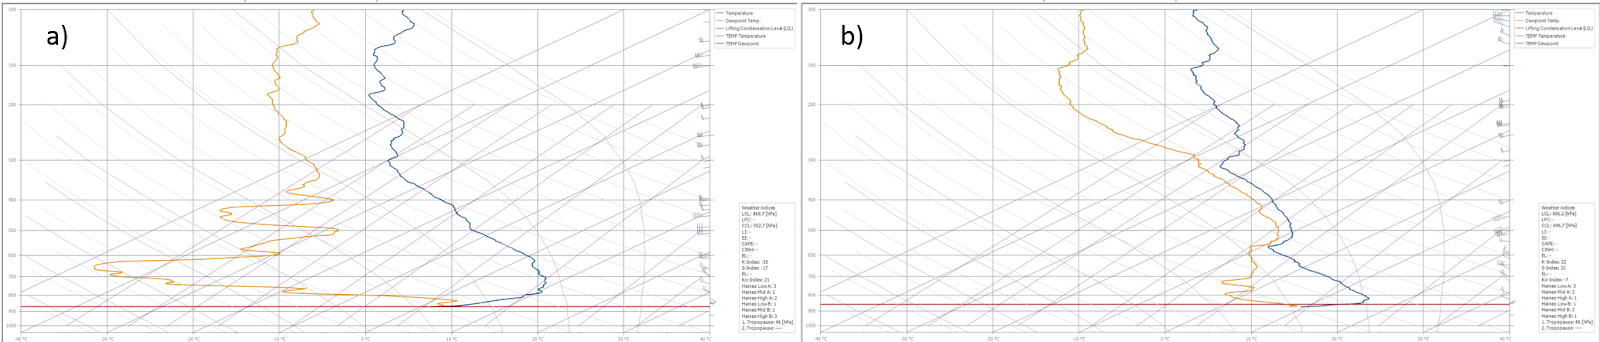
Data from the radiosonde station at the premises of Tribhuvan University Kirtipur is being released regularly at 5:45AM since March 2019. Attached to a hydrogen balloon, the radiosonde measures temperature, relative humidity, wind speed and direction at different elevations and transmits the data to a ground station.
Globally, there are hundreds of such stations that make measurements once or twice a day, synchronously providing valuable insight into the global weather pattern at different altitudes.
Comparing the Kirtipur data on 1-5 January, there is a clear indication that ground-level inversion was present on both days. This happens when a layer of cold air is trapped by warmer air above it. Ground-level inversion occurs almost every day during winter in the Valley, and has the effect of concentrating overnight pollution.
The stronger the inversion, and deeper and stronger the stable layer, which makes it harder for a parcel of air to rise as it will be relatively colder, hence denser, than its surrounding. Consequently, it is squeezed downwards.
Hence, pollutants suspended in the bottom layer of the atmosphere are pretty much confined within the inversion layer. The shallower the depth of inversion, the higher is the concentration of air pollutants, even with the same amount of emission load, since they are confined in a smaller volume near the ground.
On most days during the winter, ground-level inversion is gradually established in the Kathmandu Valley from the evening and intensifies in the night, but it weakens as it is burned away by the sun during the morning, disintegrating by noon. Once the inversion decays, the bottom layer of air mixes with the higher levels of the atmosphere, leading to lowering of air pollution level at the surface.
In addition, as the wind picks up towards the afternoon, much of the air pollution is blown away to the east, leading to a reduction of the concentration of air pollutants in the Valley.
However, from the afternoon of 3 January till the morning of 6 January, Nepal was under the influence of a westerly disturbance, and the most parts of the country were covered by high clouds (Figure 3) with light scattered precipitation in the western parts of the country.
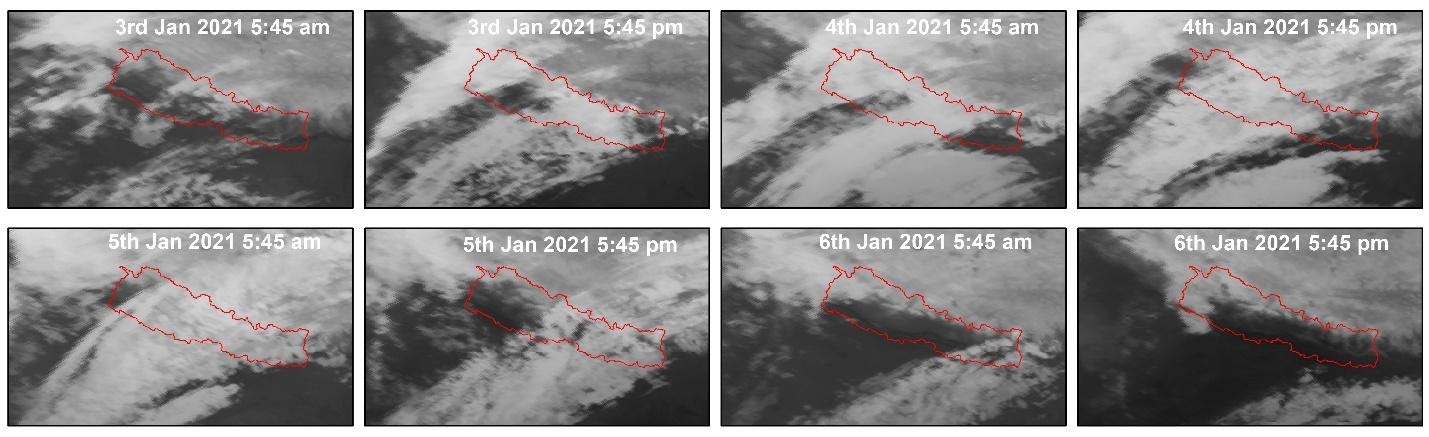
The overcast condition, however, prevented the sun from dissipating the inversion and prevented the mixing of the lower atmospheric levels with upper layers over most parts of Nepal, including Kathmandu Valley.
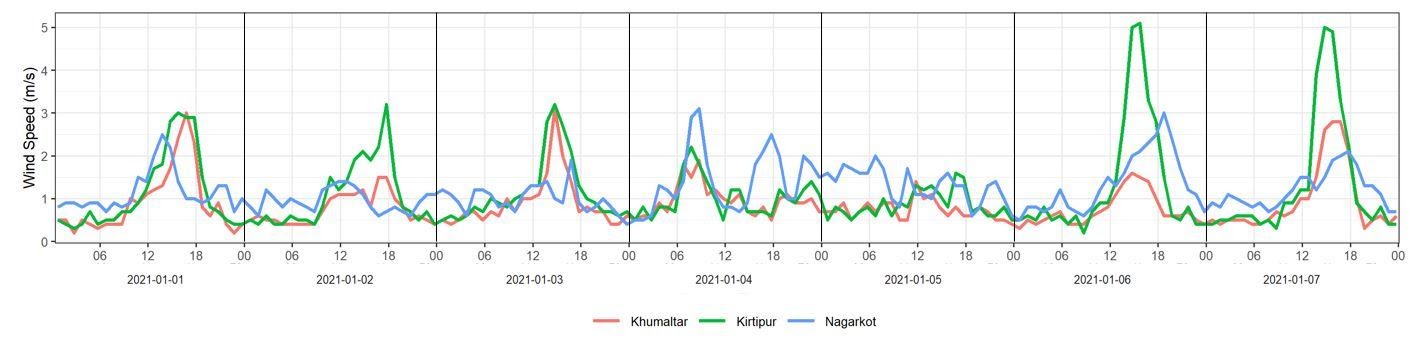
It can be inferred that the surface inversion did not fully disintegrate on those days though it would have been weakened and lifted slightly higher in the afternoon. This is also supported by the relatively calm winds recorded in the afternoons of 4 and 5 January, at Kirtipur and Khumaltar stations (Figure 5).
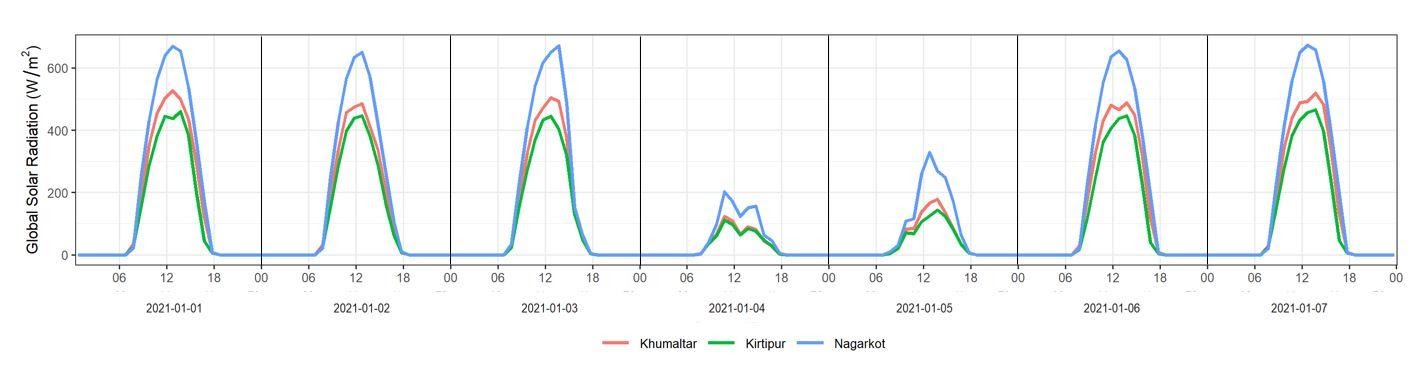
Daily average AQI PM2.5 values in stations outside Kathmandu valley remained more or less stable from last week of December to 5 January, which goes to show that the higher concentration of PM2.5 in the Kathmandu Valley on 4-5 January was mostly contributed by the local sources. Moreover, the relatively lower levels recorded at Nagarkot station on the same days is likely due to confinement of pollutants within the valley.
With the passage of western disturbance, the sky over Kathmandu Valley became clear from the early morning of 6 January. As a result, mixing of the bottom layer of air with the higher levels became possible, thus leading to subsequent dissipation of pollutants from the valley floor much sooner than anticipated.
Short term changes in the weather conditions can lead to a significant variation in the level of air pollution in the Kathmandu Valley, especially during the winter season. It is interesting to note that adverse weather conditions alone can significantly enhance the pollution level in the valley even when the socio-economic activities remained subdued after the onset of Covid-19 pandemic in the last spring in Nepal as well as globally.
More collaboration among the government agencies engaged in air pollution and weather monitoring and forecasting, and researchers is required. Moreover, there is a need to further strengthen the capacity of various agencies so that citizens can be informed not just about prevailing pollution levels, but forewarned a few days in advance about impending episodes of a hazardous deterioration in the AQI level.
Partnering to share information about prevalent pollution levels will provide valuable returns on recent investments made by the government in establishing and maintaining online air quality monitoring and meteorological stations.
Jagdishwor Karmacharya and Shanti Kandel are with the Department of Hydrology and Meteorology. Sunny Maharjan, Kamal Datta Acharya and Bikash Nepal helped analyse the results. A more technical version of this article can be found at ‘Climatic Articles, Reports and Papers’ section in the DHM website.